EMA12 and EMA26
Overlays EMA12 and EMA26
- Google Search: ema 12 ema 26 coinbase
- YouTube Search: Overlays EMA12 and EMA26
YouTube Videos Explaining Overlays EMA 12 & EMA 26
- 10:10 Moving average explained | EMA12 and EMA26 on Coinbase Pro – GDAX
- what is a moving average and how they are calculated
- A moving average is a general method of summarizing numerical values over time.
- OHLC – open, high, low, and closing values for each period
- Moving averages are combined with candlesticks to give us another value
- for each of these periods.
- In addition to OHLC values, with moving averages, we get an average for each period.
- This average is said to be moving, because it is calculated using a Sliding Window.
- Moving averages are calculated using a sliding window.
- When a new time period begins, the window slides forward, and a new candlestick is generated.
- The candlestick and average are both updated as new trades come in
- this is how the average moves over time
- each time we get a new candlestick, we get a new average value
Three things to Understand about Moving Averages
- What is the length of the window ?
- How are the values in the window averaged ?
- Which values in the window are averaged ?
- When we look at which values are averaged,
- we will also consider, how this summarizes the trade history.
We will use EMA12 for our discussion
- Everything we learn about EMA12 will apply to EMA26 and any other EMA
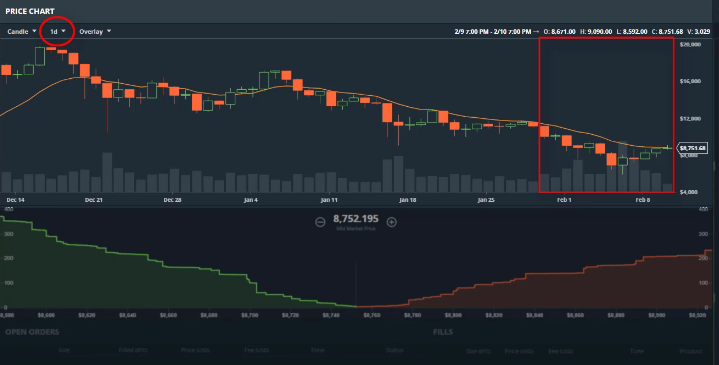
- He points to the Overlay button on the Trade screen,
- which then displays a submenu for EMA12 and EMA26
- He selects EMA12
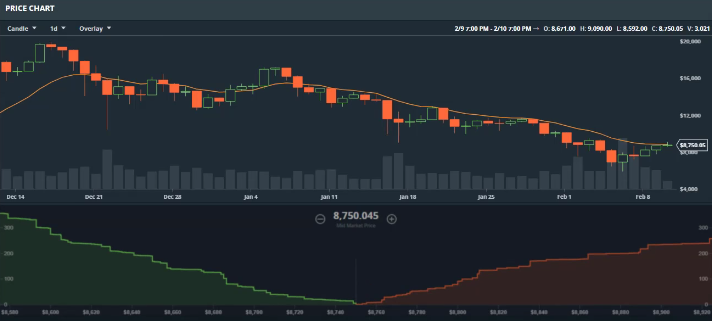
- The first thing to notice is that the line is moving with the price.
- Even though the line is solid, the values are discrete
- Each candlestick now has an EMA12 value associated with it
- These values could be represented using dots, however we have a line.
- Think of this line as just connecting the dot at each candlestick
- At each candlestick the EMA12 value gives us an average price
- The 12 (in EMA12) tells us the length of the window used to calculate this average price
- The 12 reveals that the window starts at the current candlestick
- and moves back by 12 periods
- in this case, each period is one day, that you set on the Trade Screen
- We can call this moving average a 12 day moving average.
- If we had minutes selected for our period, you can call this a 12 minute moving average.
- The number and the name is the link of the window
- Other applications allow you to pick the length of the window
- Coinbase Pro only gives you the two windows of 12 and 26
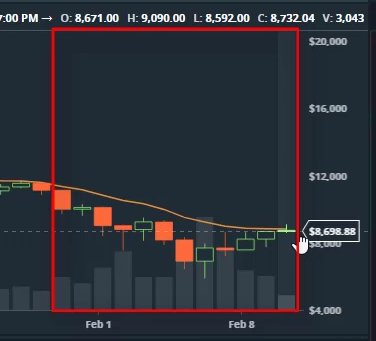
- The 12 allows us to realize,
- that even though the price has been moving a lot over the last 12 days,
- it has roughly been around, whatever the average is for the EMA12.
- We don’t actually get a reading, we can just estimate
- so if we hoover (by moving the cursor to the first period)
- we can see that the average price of the last 12 days has been roughly 8,700 dollars
- When a new period begins, the last value in the window drops off,
- and a new value is added at the start of the window.
- All the while, there are always 12 values in the window
- so the 12th value will get taken out,
- and a new value will be added at the front of the window.
- This is how the average moves over time.
How the Values in the Window are Averaged
- Looking at the symbol EMA12,
- we know that the 12 describes the length of the window
- the MA means Moving Average – that tells us that there is a window
- the E stands for Exponential – this term tells us
- how the values in the window are averaged
- The normal average that most of us are use to, is a uniform average
- The Uniform Average is known as an SMA – Simple Moving Average
- that means that for every value in the calculation, has the same weight
- or influence on the average
- Example: SMA4: (v1)(.25) + (v2)(.25) + (v3)(.25) + (v4)(.25)
- Exponential Moving Averages provide a specific way of shifting the weight of the values.
- Exponential Moving Averages gives higher weight to values in the front of the window.
- This means that prices that have occurred more recently, get higher weight.
- Example: SMA4: (v1)(.25) + (v2)(.25) + (v3)(.25) + (v4)(.25)
- Example: EMA4: (v1)(.75) + (v2)(.10) + (v3)(.03) + (v4)(.02)
- This pulls the average in their direction when the calculation is performed.
Which Values Are Used in the Calculation
- We know that the values that have occurred more recently have more weight
- but which values are actually being used.
- It still might be that Coinbase doesn’t tell us this,
- but its safe to assume that the values being used, are the closing prices of each period
- OHLC (Open, High, Low, Closed)
- it’s the Closed value that they are using
- but its safe to assume that the values being used, are the closing prices of each period
- This is the convention when doing these calculations
- For our example, we are using the EMA12
- so we can start at the latest candlestick
- and find all the closing values going back by 12 candlesticks
- and this will give us the values that were used
- to calculate the EMA12 moving average
- Some platforms will give us the ability to use other values
- like the open, or the high or the low
- But the convention is to use the Close
A Review
- We now have enough knowledge to fully understand what EMA12 is telling us
- If we look at the EMA12 value at any candlestick,
- we know that this value gives us the average closing price
- starting at that candlestick and going back by 12 candlesticks
- We also know that the calculation is using exponential weighting
- which means more weight is given to more recent candlesticks
- before we conclude, I want to consider, what these facts mean,
- in terms of summarizing historical price action
- When we say historical price action, we are ultimately referring to the Trade History
- Note, the same Trade History panel from the Trade Screen
- Most of the time, we are looking at a candlestick chart, which means
- we are actually looking at the trade history, but a summary of the trade history
- And like what we have just seen, most moving averages
- are applied to closing prices of candlesticks
- The moving average is a summary of the candlesticks,
- which are a summary of the trade history
- This means that moving averages are losing further information
- about the actual trading activity.
- Moving averages use a single price, the closing price,
- for each time period in their calculation,
- even though there are many trades with varying prices in each period
Moving Averages do not include Volume information
- Moving Averages also do not include volume
- which is a primary piece of information in the trade history.
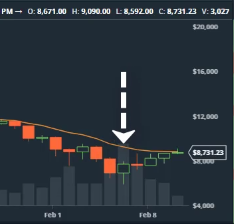
- If we look at this candlestick for example,
- we can see that a relatively large number of bitcoins traded here
- as represented by the larger volume bar.
- But that has no effect on the moving average calculation.
- Only a single trade from this period,
- acted as a representative for the whole period in the moving average calculation.
This concludes our discussion of Moving Averages
- This concludes our discussion of moving averages
- and what information they are conveying.